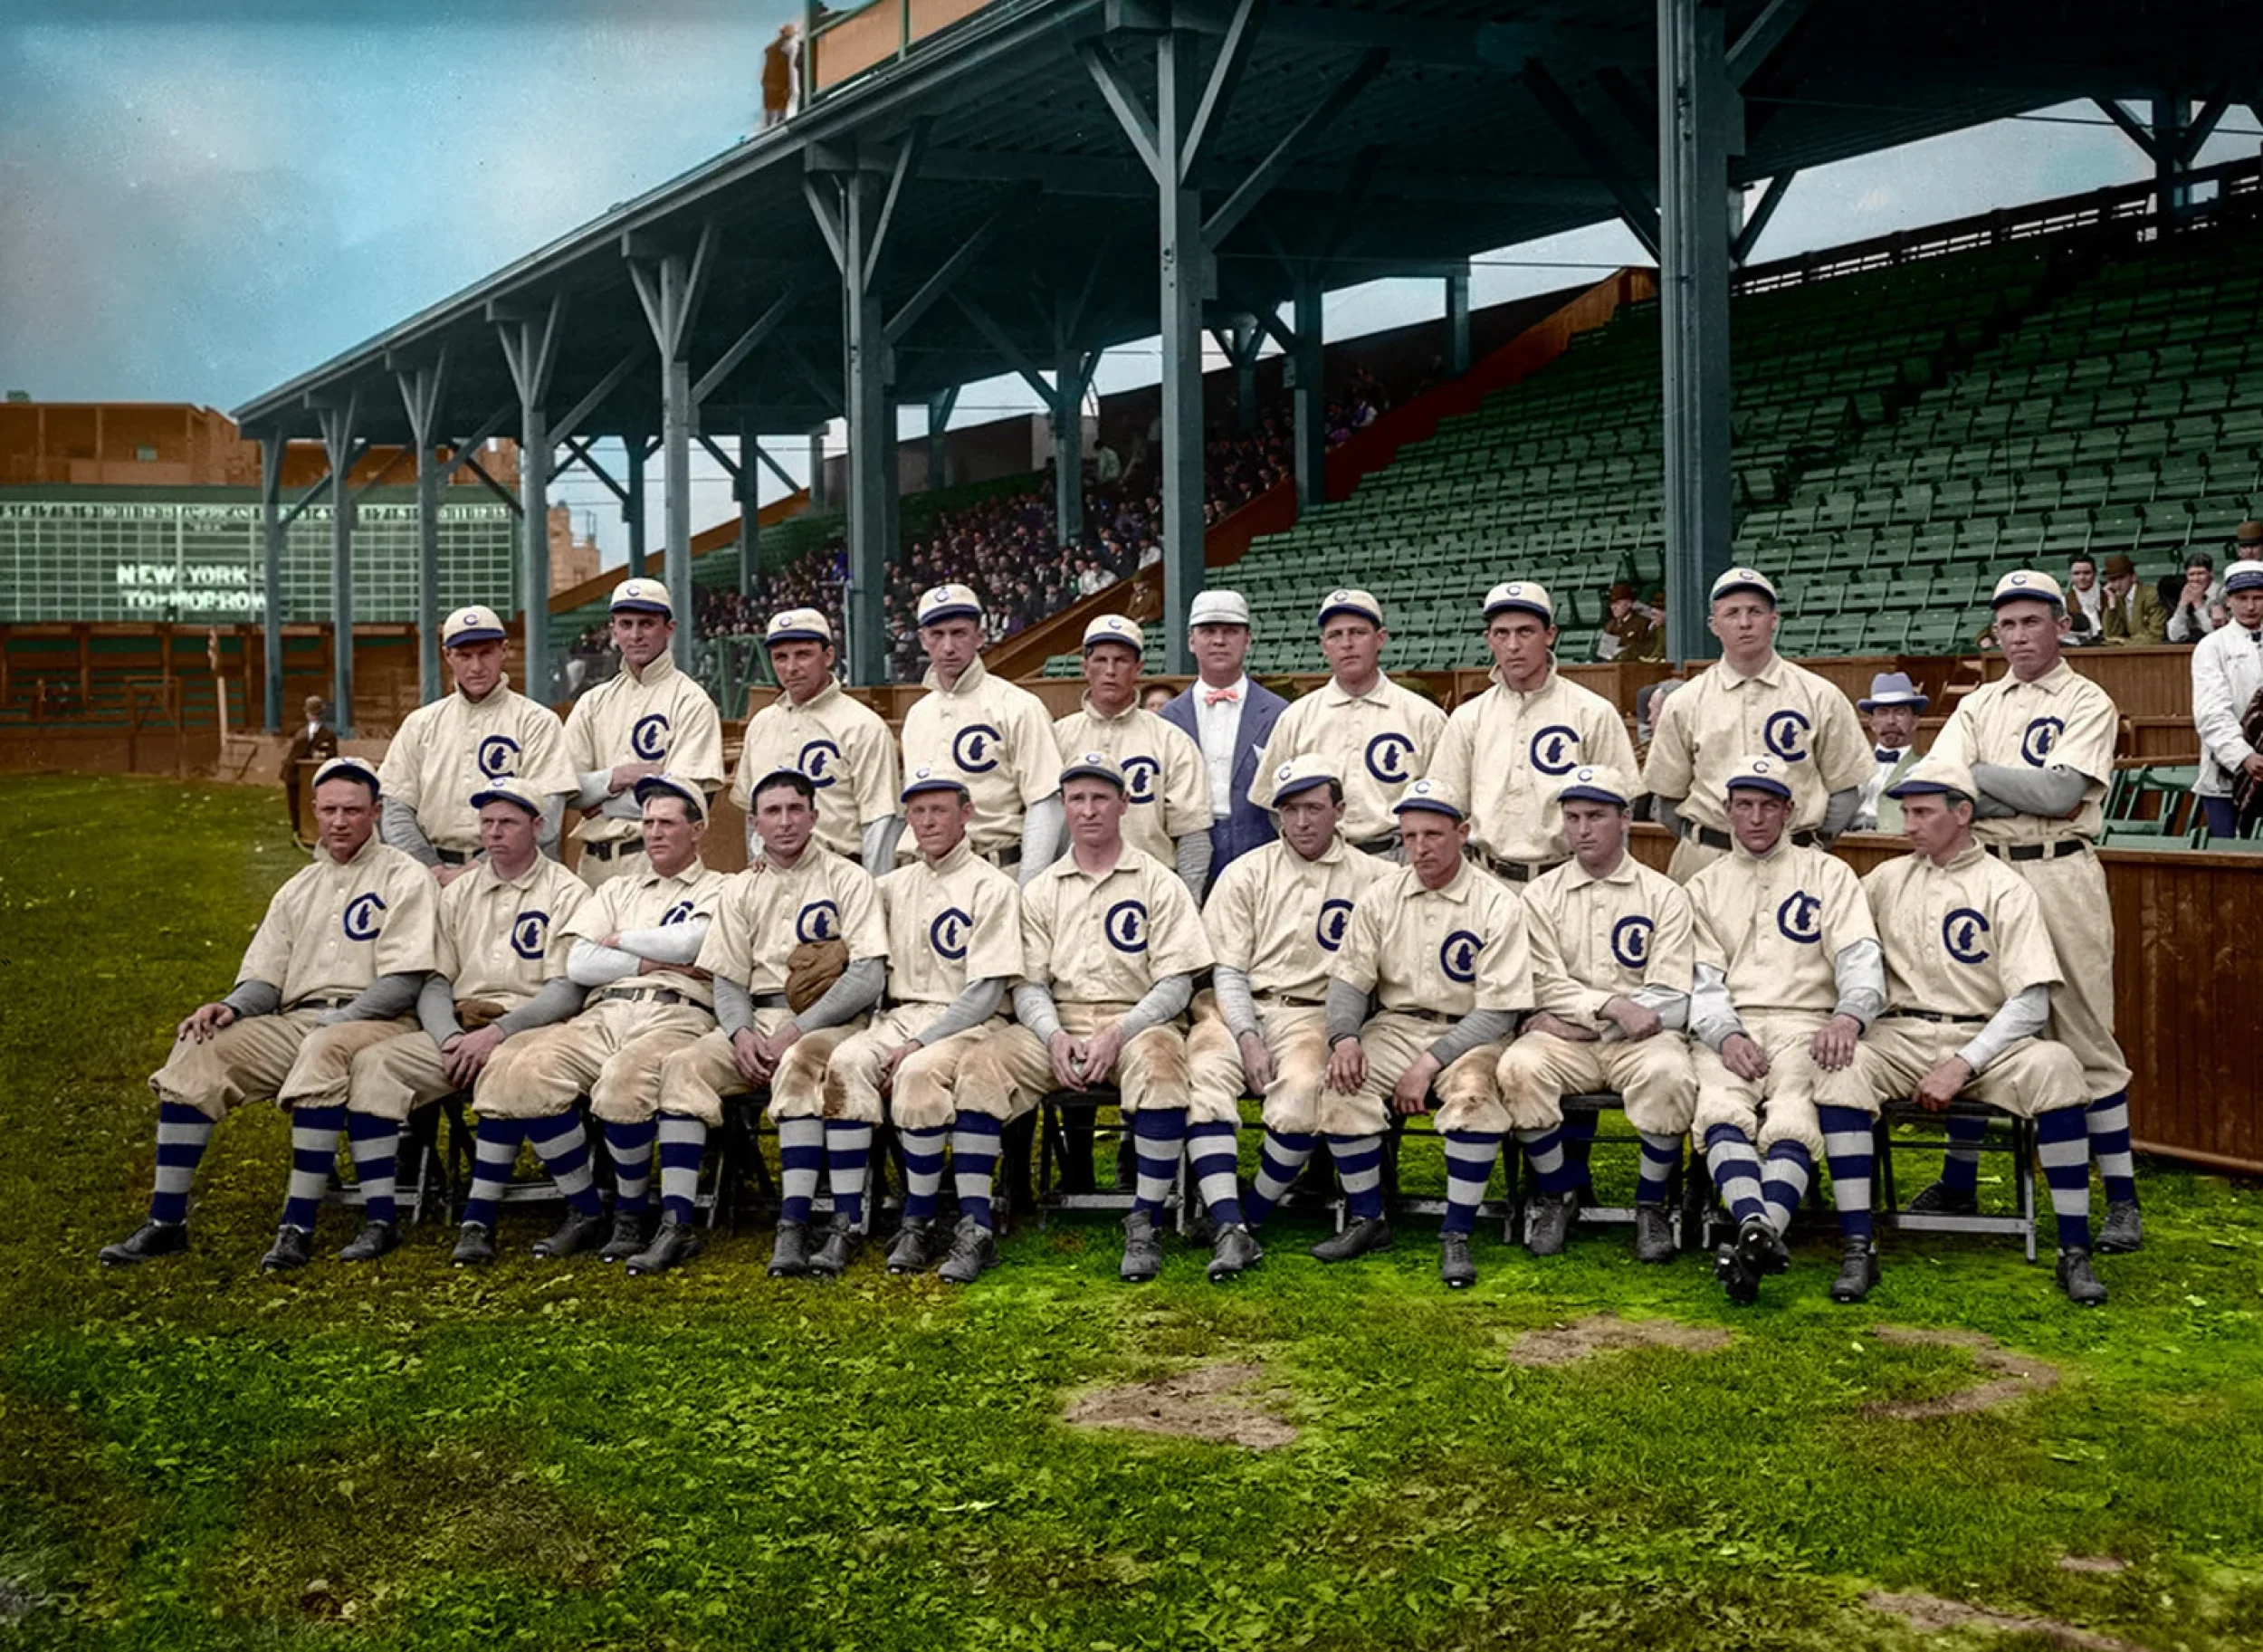

Panoramic Photo Above:
1908 World Series Champion Chicago Cubs
(Colorized by Mark Doyle Photography)
Baseball History Comes Alive Now Ranked As a Top Five Website by Feedspot Among All Baseball History Websites and Blogs!
(Check out Feedspot's list of the Top 35 Baseball History websites and blogs)
Guest Submissions From Our Readers Always Welcome! Click for details
Scroll Down to Read Today’s Essay
Subscribe to Baseball History Comes Alive for automatic updates. As a Free Bonus, you’ll get instant access to my Special Report: Gary’s Handy Dandy World Series Reference Guide!
What I like about contributor Vince Janowski is that he really does his homework. And he’s not afraid to crunch numbers and go deep into a subject. So today we present something new to Baseball History Comes Alive: The first of Vince’s four-part series on, yes…double plays…and how does the number of them over the course of a season affect the team’s standings? I think you’ll be in for a surprise.
I realize examining any particular subject to such an extent may not appeal to everyone, but here on BHCA I’m betting we’ve got some pretty sophisticated readers who will relish the chance to go heavily into any topic related to the game we all love. So I hope you’ll give Vince’s essay a “look-see”…and then will tune in for future installments as we go along with Vince into his “deep dive” into double plays! -GL
Vince Jankoski Takes A Very Deep Dive Into Double Plays!
DOUBLE PLAYS
These are the saddest possible words:
“Tinker to Evers to Chance.”
Trio of bear cubs, and fleeter than birds,
Tinker and Evers and Chance.
Ruthlessly pricking our gonfalon bubble,
Making a Giant hit into a double –
Words that are heavy with nothing but trouble
“Tinker to Evers to Chance.”
Franklin Pierce Adams, July 10, 1910.
There has always been a place in my heart for double plays, especially ground ball double plays. Ground ball double plays are exciting, usually close, inning and sometimes game-altering, and nearly always an exercise of multiple skills of multiple players. They are the most artistic of all baseball plays. But is there a correlation between the number of ground ball double plays made by a team and that team’s success or lack of it?
I began this essay seeking to determine whether such a correlation exists. Although that was my initial inquiry, my research led me in a different direction.
Acknowledging that double plays come in various forms: strike ‘em out, throw ‘em out; a baserunner thrown out attempting to advance after a fly out; a baserunner doubled off his base after a fly out; a line drive to an infielder catching a baserunner off base, most double plays are of the infield ground ball variety. The other types will probably even out over the years such that the number of double plays made by a team in a given year (a number easily researchable) will most likely reflect directly the number of ground ball double plays generated by the team (the number of my concern). This essay proceeds on that assumption.
There are, by my count, two ways of looking at the question under consideration. First, good teams make outs and double plays count as two outs. So, there should be a direct relationship between the number of double plays a team makes and the number of wins the team attains. Second and conversely, bad teams have bad pitching. Bad pitching puts runners on base, allowing for more opportunities to make double plays. So, under this theory, there should be an inverse relation between double plays and the success of a team.
The numbers do not support either hypothesis. Trust me. I’ve done the research – a lot of it. With a few notable exceptions noted below, the team leader in double plays is as likely to finish in the second division as win the pennant. Pennant winners lead the league in double plays only occasionally, again with a few exceptions to be discussed.
I’ve broken the analysis into deadball (post 1901) and lively ball eras and American and National Leagues. In the Deadball Era in the American League, league leaders in double plays finished in the standings first once, second twice, third and fourth four times, sixth three times, seventh twice, and last three times. In the National League, the results are similar: first twice, third four times, fourth three times, fifth once, sixth twice, seventh 3 times, and last four times.
During the Deadball Era, pennant winners in the American League led the league in double plays once, were second or tied for second 3 times, were third, fourth, fifth or tied for third, fourth, and fifth three times, were seventh twice, and last three times. In the National League, pennant winners led or tied for the league lead in double plays twice, were second or tied for second four times, were third in DPs once, were fourth or tied for fourth six times, were fifth once, sixth three times, and last twice.
Not much of a correlation in those figures.
In dead ball times teams sacrificed and stole bases, limiting the opportunities for double plays. No team in any league, including the Federal League, turned more than 148 DPs in a single season. Speaking of the Federal League, its double play numbers were not included in this analysis for various reasons, but for the record, its league leaders in double plays finished sixth and last in the standings during the two years of the league’s existence.
Double plays increased after the advent of the lively ball. Only one team in the 1920s (the 1926 Dodgers) failed to notch at least 100 double plays in a season with a high of 194 for the 1928 Reds who finished fifth in the standings.
However, the correlations are no stronger in the era of the lively ball. In the years 1920 to 1949, American League leaders in double plays finished in the standings first three times, second once, third four times, fourth twice, fifth six times, sixth seven times, seventh six times, and last twice. In the National League the numbers are first seven times, second six times, third twice, fourth once, fifth twice, sixth six times, seventh five times, and last three times. The National League total exceeds the number of years due to ties in league leaders in double plays in 1934.
Pennant winners in those years finished in double plays in the American League first three times, second six times, third three times, fourth twice, fifth three times, sixth or tied for sixth three times, seventh three times, and last seven times. In the National League, the numbers are: first or tied for first in double plays seven times, second or tied for second ten times, third once, fourth or tied for fourth twice, sixth or tied for sixth five times, seventh four times, and last once.
The 1925 World Series featured pennant winners who also led their leagues in double plays (Washington and Pittsburgh). The following year featured teams that finished last and next to the last in double plays (the Cardinals and Yankees). Pittsburgh won pennants in 1925 while leading the league in double plays and 1927 while finishing tied for sixth in twin killings. The Yankees made three consecutive World Series appearances (1926-1928) despite finishing last, last, and next to the last in double plays. The 1930 American League and National League DP leaders finished first (NL) and last (AL). Nothing to suggest a correlation there.
As I moved my analysis to the 1950s, I began to notice the futility of my task. There was no correlation (positive or negative) between turning double plays and winning (or losing) baseball. Besides, I could discern no reason why the figures post-1950 would be any different than in earlier years. So, I stopped a detailed analysis at 1949. However, as I gazed into the 1950s, I noticed that certain teams turned an inordinate amount of double plays. Perhaps the correct way to look at double plays is not through a global view of double plays on a league basis, but rather to look at individual teams. That is where things got interesting. Stay tuned for the next installment.
Vince Jankoski
Subscribe to our website, Baseball History Comes Alive with over 1400 fully categorized baseball essays and photo galleries, now surpassing the one million hits mark with 1.073 million hits and over 900 subscribers: https://wp.me/P7a04E-2he

This was a fun read Vince and thank you for sharing. When there’s not a correlation there’s no sense in trying to make one up!
Mark
Vince,
Agree with Gary and Mark, your affinity for stats is mesmerizing. I’m hoping you’ll come up with one key double play that turned a famous pennant race 72 years ago. It was a dandy.
If you do, you’ll get a rare BHCA gold star!
Best,
Bill
Bill,
I don’t know if I will be able to find a single DP that determined the 1951 pennant race, but the Brooklyn Dodgers were a “double play machine” in the early 1950’s. Stay tuned for more on that in future installments.
Inane and anal comment—-oi am pretty sure that Pittsburg had an H at the end by 1925.
Murray,
You are correct, although both spellings were acceptable in years past. The “h” was officially added in 1911. I hope I did not offend the burghers of Pittsburgh. If I did, I think I made sufficient amends in the later installments. Think Bill Mazeroski.
I added the “H”!
A great read and analysis. The numbers are not in yet but I think the number of DPs will probably take a dip with the advent of the larger bases. There is a 3″ shorter distance between 1st and 2nd and also between 2nd and 3rd. It’s 1 1/2 inches shorter between Home and 1st and between 3rd and home. Only time will tell.
Looking forward to more of this. Very interesting. I wonder how the standings would be affected by the number of times teams hit into double plays in a season. Not sure if that data is out there. Also, seem to recall some obscure stat where Tigers Dick McAuliffe played a whole season in 1968 without grounding into a double play, over 600 plate appearances if memory serves me correct.